

Log in or register to download unlimited Forex robots!
pSAR bug 4
This expert is made for opening and closing respective orders at the first parabolic sar signal. the perfomance of this EA is depends on custom parameters of stop loss,take profit,trailing stop etc.
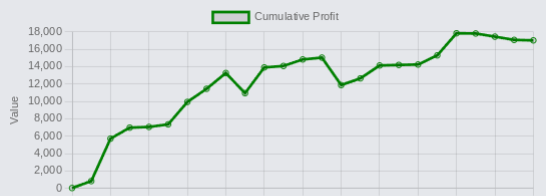
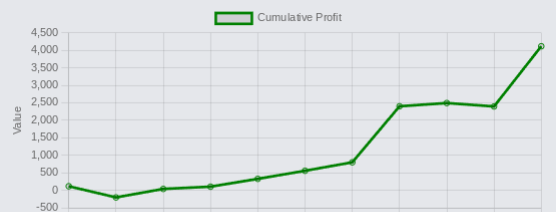
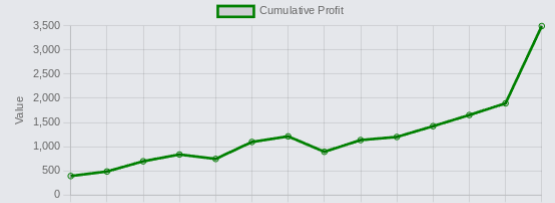
The strategy report is given bellow..
Strategy Tester Report
pSAR bug 3
Finexo-Real (Build 226)
Symbol EURJPY (Euro vs Japanese Yen)
Period 30 Minutes (M30) 2010.01.04 02:30 - 2010.06.20 23:30 (2010.01.01 - 2010.06.21)
Model Every tick (the most precise method based on all available least timeframes)
Parameters StopLoss=90; TakeProfit=20; Lots=10; Slippage=5; Caution="Advanced settings follow. Dont change if you dont know what you are doing."; Step=0.001; Maximum=0.2; StopMult=true;
Bars in test 5906 Ticks modelled 13972529 Modelling quality n/a
Mismatched charts errors 7997
Initial deposit 10000.00
Total net profit 106621.64 Gross profit 147443.80 Gross loss -40822.15
Profit factor 3.61 Expected payoff 1545.24
Absolute Array 1316.32 Maximal Array 18684.41 (32.35%) Relative Array 48.61% (11109.22)
Total trades 69 Short positions (won %) 35 (100.00%) Long positions (won %) 34 (88.24%)
Profit trades (% of total) 65 (94.20%) Loss trades (% of total) 4 (5.80%)
Largest profit trade 2343.41 loss trade -10212.07
Average profit trade 2268.37 loss trade -10205.54
Maximum consecutive wins (profit in money) 24 (54387.37) consecutive losses (loss in money) 1 (-10212.07)
Maximal consecutive profit (count of wins) 54387.37 (24) consecutive loss (count of losses) -10212.07 (1)
Average consecutive wins 13 consecutive losses 1
# Time Type Order Size Price S / L T / P Profit Balance
1 2010.01.04 10:47 buy 1 10.00 133.549 132.649 133.749
2 2010.01.04 13:17 t/p 1 10.00 133.749 132.649 133.749 2269.50 12269.50
3 2010.01.05 05:37 sell 2 10.00 132.634 133.534 132.434
4 2010.01.05 05:47 t/p 2 10.00 132.434 133.534 132.434 2268.73 14538.23
5 2010.01.05 05:47 sell 3 10.00 132.394 133.294 132.194
6 2010.01.05 06:05 t/p 3 10.00 132.194 133.294 132.194 2268.73 16806.96
7 2010.01.06 16:12 buy 4 10.00 133.103 132.203 133.303
8 2010.01.06 16:47 t/p 4 10.00 133.303 132.203 133.303 2269.51 19076.47
9 2010.01.12 02:17 sell 5 10.00 133.221 134.121 133.021
10 2010.01.12 03:05 t/p 5 10.00 133.021 134.121 133.021 2268.73 21345.20
11 2010.01.13 14:00 buy 6 10.00 133.069 132.169 133.269
12 2010.01.14 03:47 t/p 6 10.00 133.269 132.169 133.269 2343.41 23688.61
13 2010.01.14 16:36 sell 7 10.00 131.956 132.856 131.756
14 2010.01.14 17:17 t/p 7 10.00 131.756 132.856 131.756 2268.73 25957.34
15 2010.01.21 02:18 buy 8 10.00 129.084 128.184 129.284
16 2010.01.21 08:05 t/p 8 10.00 129.284 128.184 129.284 2269.50 28226.84
17 2010.01.21 16:17 sell 9 10.00 128.468 129.368 128.268
18 2010.01.21 16:42 t/p 9 10.00 128.268 129.368 128.268 2268.73 30495.57
19 2010.01.26 01:17 buy 10 10.00 128.114 127.214 128.314
20 2010.01.26 02:17 t/p 10 10.00 128.314 127.214 128.314 2269.50 32765.07
21 2010.01.26 06:07 sell 11 10.00 126.590 127.490 126.390
22 2010.01.26 06:17 t/p 11 10.00 126.390 127.490 126.390 2268.73 35033.80
23 2010.01.26 06:17 sell 12 10.00 126.350 127.250 126.150
24 2010.01.26 07:37 t/p 12 10.00 126.150 127.250 126.150 2268.73 37302.53
25 2010.01.28 08:12 buy 13 10.00 126.687 125.787 126.887
26 2010.01.28 08:42 t/p 13 10.00 126.887 125.787 126.887 2269.50 39572.03
27 2010.01.28 17:17 sell 14 10.00 125.310 126.210 125.110
28 2010.01.29 01:17 t/p 14 10.00 125.110 126.210 125.110 2230.02 41802.04
29 2010.02.01 16:12 buy 15 10.00 126.253 125.353 126.453
30 2010.02.01 16:17 t/p 15 10.00 126.453 125.353 126.453 2269.50 44071.54
31 2010.02.01 16:17 buy 16 10.00 126.493 125.593 126.693
32 2010.02.03 11:17 t/p 16 10.00 126.693 125.593 126.693 2318.80 46390.34
33 2010.02.04 09:42 sell 17 10.00 125.792 126.692 125.592
34 2010.02.04 10:23 t/p 17 10.00 125.592 126.692 125.592 2268.73 48659.07
35 2010.02.09 03:07 buy 18 10.00 122.227 121.327 122.427
36 2010.02.09 06:07 t/p 18 10.00 122.427 121.327 122.427 2269.50 50928.57
37 2010.02.11 12:12 sell 19 10.00 123.184 124.084 122.984
38 2010.02.11 13:17 t/p 19 10.00 122.984 124.084 122.984 2268.73 53197.30
39 2010.02.15 23:48 buy 20 10.00 122.524 121.624 122.724
40 2010.02.16 05:47 t/p 20 10.00 122.724 121.624 122.724 2294.15 55491.45
41 2010.02.18 01:47 sell 21 10.00 123.627 124.527 123.427
42 2010.02.18 03:00 t/p 21 10.00 123.427 124.527 123.427 2268.71 57760.16
43 2010.02.18 20:47 buy 22 10.00 124.480 123.580 124.680
44 2010.02.19 01:17 s/l 22 10.00 123.580 123.580 124.680 -10188.01 47572.14
45 2010.02.23 03:00 sell 23 10.00 123.819 124.719 123.619
46 2010.02.23 12:17 t/p 23 10.00 123.619 124.719 123.619 2268.73 49840.87
47 2010.02.26 01:02 buy 24 10.00 120.913 120.013 121.113
48 2010.02.26 01:12 t/p 24 10.00 121.113 120.013 121.113 2269.53 52110.40
49 2010.02.26 01:12 buy 25 10.00 121.153 120.253 121.353
50 2010.02.26 03:17 t/p 25 10.00 121.353 120.253 121.353 2269.53 54379.93
51 2010.03.01 14:00 sell 26 10.00 120.485 121.385 120.285
52 2010.03.01 16:17 t/p 26 10.00 120.285 121.385 120.285 2268.75 56648.68
53 2010.03.03 07:05 buy 27 10.00 121.257 120.357 121.457
54 2010.03.03 17:12 t/p 27 10.00 121.457 120.357 121.457 2269.50 58918.18
55 2010.03.09 02:00 sell 28 10.00 122.709 123.609 122.509
56 2010.03.09 03:37 t/p 28 10.00 122.509 123.609 122.509 2268.62 61186.80
57 2010.03.10 10:12 buy 29 10.00 122.672 121.772 122.872
58 2010.03.10 11:47 t/p 29 10.00 122.872 121.772 122.872 2269.34 63456.14
59 2010.03.15 10:17 sell 30 10.00 124.368 125.268 124.168
60 2010.03.15 15:17 t/p 30 10.00 124.168 125.268 124.168 2268.60 65724.74
61 2010.03.16 15:47 buy 31 10.00 124.528 123.628 124.728
62 2010.03.17 06:07 t/p 31 10.00 124.728 123.628 124.728 2294.01 68018.75
63 2010.03.18 02:17 sell 32 10.00 123.716 124.616 123.516
64 2010.03.18 06:12 t/p 32 10.00 123.516 124.616 123.516 2268.60 70287.35
65 2010.03.23 00:09 buy 33 10.00 122.336 121.436 122.536
66 2010.03.23 00:47 t/p 33 10.00 122.536 121.436 122.536 2269.37 72556.72
67 2010.03.30 02:11 sell 34 10.00 124.417 125.317 124.217
68 2010.03.30 02:53 t/p 34 10.00 124.217 125.317 124.217 2268.60 74825.32
69 2010.03.30 08:18 buy 35 10.00 125.087 124.187 125.287
70 2010.03.30 08:36 t/p 35 10.00 125.287 124.187 125.287 2269.37 77094.69
71 2010.04.05 07:38 sell 36 10.00 127.324 128.224 127.124
72 2010.04.05 17:06 t/p 36 10.00 127.124 128.224 127.124 2268.58 79363.27
73 2010.04.08 15:36 buy 37 10.00 124.429 123.529 124.629
74 2010.04.08 18:36 t/p 37 10.00 124.629 123.529 124.629 2269.20 81632.47
75 2010.04.13 01:03 sell 38 10.00 126.533 127.433 126.333
76 2010.04.13 01:08 t/p 38 10.00 126.333 127.433 126.333 2268.45 83900.92
77 2010.04.13 01:08 sell 39 10.00 126.293 127.193 126.093
78 2010.04.13 02:06 t/p 39 10.00 126.093 127.193 126.093 2268.44 86169.36
79 2010.04.14 01:38 buy 40 10.00 127.262 126.362 127.462
80 2010.04.14 07:06 t/p 40 10.00 127.462 126.362 127.462 2269.22 88438.58
81 2010.04.15 09:53 sell 41 10.00 126.165 127.065 125.965
82 2010.04.15 10:08 t/p 41 10.00 125.965 127.065 125.965 2268.48 90707.06
83 2010.04.19 22:39 buy 42 10.00 124.836 123.936 125.036
84 2010.04.20 02:06 t/p 42 10.00 125.036 123.936 125.036 2293.84 93000.89
85 2010.04.21 12:36 sell 43 10.00 124.411 125.311 124.211
86 2010.04.22 02:21 t/p 43 10.00 124.211 125.311 124.211 2152.38 95153.27
87 2010.04.23 12:36 buy 44 10.00 124.753 123.853 124.953
88 2010.04.23 13:03 t/p 44 10.00 124.953 123.853 124.953 2269.30 97422.57
89 2010.04.27 10:36 sell 45 10.00 124.973 125.873 124.773
90 2010.04.27 10:53 t/p 45 10.00 124.773 125.873 124.773 2268.47 99691.04
91 2010.04.27 10:53 sell 46 10.00 124.733 125.633 124.533
92 2010.04.27 13:38 t/p 46 10.00 124.533 125.633 124.533 2268.47 101959.51
93 2010.04.28 13:53 buy 47 10.00 124.905 124.005 125.105
94 2010.04.28 14:51 s/l 47 10.00 124.005 124.005 125.105 -10211.73 91747.78
95 2010.05.04 09:23 sell 48 10.00 124.559 125.459 124.359
96 2010.05.04 09:42 t/p 48 10.00 124.359 125.459 124.359 2268.50 94016.28
97 2010.05.07 02:32 buy 49 10.00 116.309 115.409 116.509
98 2010.05.07 03:17 t/p 49 10.00 116.509 115.409 116.509 2269.28 96285.56
99 2010.05.11 01:10 sell 50 10.00 118.292 119.192 118.092
100 2010.05.11 04:07 t/p 50 10.00 118.092 119.192 118.092 2268.50 98554.06
101 2010.05.17 11:27 buy 51 10.00 114.224 113.324 114.424
102 2010.05.17 11:47 t/p 51 10.00 114.424 113.324 114.424 2269.35 100823.41
103 2010.05.18 17:42 sell 52 10.00 113.228 114.128 113.028
104 2010.05.18 18:00 t/p 52 10.00 113.028 114.128 113.028 2268.57 103091.98
105 2010.05.19 20:40 buy 53 10.00 113.810 112.910 114.010
106 2010.05.19 21:36 t/p 53 10.00 114.010 112.910 114.010 2269.35 105361.33
107 2010.05.20 13:42 sell 54 10.00 111.153 112.053 110.953
108 2010.05.20 14:10 t/p 54 10.00 110.953 112.053 110.953 2268.58 107629.91
109 2010.05.21 04:07 buy 55 10.00 113.896 112.996 114.096
110 2010.05.21 04:17 t/p 55 10.00 114.096 112.996 114.096 2269.35 109899.26
111 2010.05.21 04:17 buy 56 10.00 114.136 113.236 114.336
112 2010.05.21 04:22 t/p 56 10.00 114.336 113.236 114.336 2269.35 112168.61
113 2010.05.21 04:22 buy 57 10.00 114.376 113.476 114.576
114 2010.05.21 05:03 s/l 57 10.00 113.476 113.476 114.576 -10212.07 101956.54
115 2010.05.25 06:15 sell 58 10.00 109.981 110.881 109.781
116 2010.05.25 07:37 t/p 58 10.00 109.781 110.881 109.781 2268.50 104225.04
117 2010.05.27 14:32 buy 59 10.00 111.484 110.584 111.684
118 2010.05.27 15:02 t/p 59 10.00 111.684 110.584 111.684 2269.25 106494.29
119 2010.05.31 14:57 sell 60 10.00 111.643 112.543 111.443
120 2010.06.01 00:52 t/p 60 10.00 111.443 112.543 111.443 2229.66 108723.95
121 2010.06.02 09:40 buy 61 10.00 112.424 111.524 112.624
122 2010.06.02 09:47 t/p 61 10.00 112.624 111.524 112.624 2268.96 110992.91
123 2010.06.02 09:47 buy 62 10.00 112.664 111.764 112.864
124 2010.06.02 12:42 s/l 62 10.00 111.764 111.764 112.864 -10210.34 100782.57
125 2010.06.04 11:02 sell 63 10.00 112.453 113.353 112.253
126 2010.06.04 11:02 t/p 63 10.00 112.253 113.353 112.253 2268.04 103050.61
127 2010.06.04 11:02 sell 64 10.00 112.212 113.112 112.012
128 2010.06.04 11:07 t/p 64 10.00 112.012 113.112 112.012 2268.03 105318.64
129 2010.06.04 11:07 sell 65 10.00 111.972 112.872 111.772
130 2010.06.04 11:12 t/p 65 10.00 111.772 112.872 111.772 2268.04 107586.68
131 2010.06.04 11:12 sell 66 10.00 111.731 112.631 111.531
132 2010.06.04 11:42 t/p 66 10.00 111.531 112.631 111.531 2268.03 109854.71
133 2010.06.09 06:32 buy 67 10.00 109.465 108.565 109.665
134 2010.06.09 11:40 t/p 67 10.00 109.665 108.565 109.665 2268.81 112123.52
135 2010.06.14 19:43 sell 68 10.00 111.781 112.681 111.581
136 2010.06.15 06:04 t/p 68 10.00 111.581 112.681 111.581 2229.32 114352.83
137 2010.06.15 16:02 buy 69 10.00 112.615 111.715 112.815
138 2010.06.15 17:15 t/p 69 10.00 112.815 111.715 112.815 2268.81 116621.64
pSAR_bug_4.mq4 5.5 kb, 42 downloads since 2014-10-06
Join the MT4talk Telegram channel: https://t.me/MT4talkchannel
Join the MT4talk Telegram group: https://t.me/+XcwLRi9oFOJhYjlk
New Bonus for PRO Members!
NEW AI Forex robot (MT4talk Trade Executor EA)
Guaranteed Profit Every Week! With the Yearly PRO and the Lifetime PRO, you can use the BONUS MT4talk Trade Executor AI Forex Robot with all brokers worldwide!
Try it 100% FREE – only pay for the MT4talk PRO membership after you start making money with the MT4talk Trade Executor AI Forex Robot!
Download it 100% FREE at https://mt4talk.org/download_latest.php


About pSAR_bug EA
https://mt4talk.com/viewtopic.php?pid=1597#p1597
The strategy behind EA is pretty straightforward. It looks at Parabolic SAR dots on your Forex chart. When these dots appear below a candlestick, it suggests a potential uptrend, and the EA recommends buying. Conversely, when the dots show up above a candlestick, it indicates a possible downtrend, and the EA suggests selling.
Now, why is this strategy good to use, you ask? Well, here's my opinion:
- The strategy is easy to understand, even if you're new to Forex trading. You don't need to be a financial whiz to grasp when to buy or sell.
- The EA helps you make quick decisions based on these dots, so you can catch potential market moves early.
- You can set parameters like StopLoss and TakeProfit to control your risk. This means you can limit potential losses and lock in profits.
Now, let's talk about the adjustable parameters:
StopLoss: This is the point at which the EA will automatically close your trade if it's going in the wrong direction.
TakeProfit: This is the point at which the EA will close your trade when it's going well, securing your profit.
Lots: It's like choosing how much you want to bet on each trade. A smaller lot size means less risk, while a larger one means potentially bigger profits (but also higher risk).
Slippage: This parameter deals with how much the market price can change before the trade is executed. Lower slippage helps you get the price you want.
Step and Maximum: These are settings related to the Parabolic SAR indicator. They help fine-tune when the EA suggests buying or selling.
StopMult: When this is true, it adjusts the StopLoss and TakeProfit values. It can be handy for compatibility with different brokers.
How to set up the EA:
Download the mq4 file.
Attach it to your MetaTrader 4 platform.
Now, let's adjust the parameters to optimize your trading strategy:
StopLoss: 90
TakeProfit: 20
Lots: 0.1
Slippage: 5
Step: 0.02
Maximum: 0.2
StopMult: True
These settings should work well as a starting point, but feel free to experiment to find what suits your trading style.
Currency Pair: EUR/USD
Minimal Balance: $1000
Time Frame: 1-hour
These settings are just a guideline to get you started.
AI Forex robot (Trade Executor EA)
NEW AI Forex robot (MT4talk Trade Executor EA)
Try it 100% FREE – Download it 100% FREE at https://mt4talk.org/download_latest.php
Guaranteed Profit Every Week!
Only use leverage 500! Do not use leverage higher than 500!
- In the EA settings, enter your MT4talk registered email address and your MT4talk forum password.
- If you yneed help, visit the MT4talk Help Center: https://mt4talk.info to chat with the chat assistant in any language!
By using the MT4talk website, you automatically agree to the Forum Rules & Terms of Use, as well as the terms below.
Everything you see on the MT4talk website is created by its users, mainly the members of the MT4talk forum, as well as the forum administrators.
What is MT4talk?
MT4talk is an online Forex forum with over 5000 Forex robots and over 3000 Forex indicators uploaded by forum members in the last 10 years, available to download from forum posts. The uploaded files do not come with support or any guarantee.
The website does not sell Forex robots and does not provide support for any downloaded Forex robots. MT4talk offers a PRO membership, allowing you to download unlimited files from forum posts. If you choose to download a Forex robot from the forum, you do so at your own risk.
The MT4talk Team also provides an Artificial Intelligence Forex robot called "Trade Executor EA," which can be downloaded by PRO members, just like any other Forex robot on the forum. This Forex robot is only a bonus and is not included in the original PRO membership.
MT4talk is an informational website and does not guarantee the performance, profitability, or reliability of any Forex robot available for download. Updates for Forex robots may be limited or nonexistent, depending on the creator. If you choose to download any Forex robot or setting file from the forum, you acknowledge that you are using it at your own risk. MT4talk PRO membership is a digital product. Therefore, after you complete the PRO membership purchase, there is no refund available!
We are conducting real-life tests on Forex robots to assess their performance. For certain robots, we may use a demo account to conduct tests, and for other Forex robots, we may use a real Forex account. It's essential to recognize that we are not financial advisors and cannot provide investment guidance. Our objective is to discover effective market analysis solutions through testing various strategies, which could be beneficial to our community.
CFTC RULE 4.41 – HYPOTHETICAL OR SIMULATED PERFORMANCE RESULTS HAVE CERTAIN LIMITATIONS. UNLIKE AN ACTUAL PERFORMANCE RECORD, SIMULATED RESULTS DO NOT REPRESENT ACTUAL TRADING. ALSO, SINCE THE TRADES HAVE NOT BEEN EXECUTED, THE RESULTS MAY HAVE UNDER-OR-OVER COMPENSATED FOR THE IMPACT, IF ANY, OF CERTAIN MARKET FACTORS, SUCH AS LACK OF LIQUIDITY. SIMULATED TRADING PROGRAMS, IN GENERAL, ARE ALSO SUBJECT TO THE FACT THAT THEY ARE DESIGNED WITH THE BENEFIT OF HINDSIGHT. NO REPRESENTATION IS BEING MADE THAT ANY ACCOUNT WILL OR IS LIKELY TO ACHIEVE PROFIT OR LOSSES SIMILAR TO THOSE SHOWN.
Disclaimer - No representation is being made that any Forex account will or is likely to achieve profits or losses similar to those shown on backtests in this forum. In fact, there are frequently sharp differences between hypothetical performance results and the actual results subsequently achieved by any particular trading program. Hypothetical trading does not involve financial risk, and no hypothetical trading record can completely account for the impact of financial risk in actual trading. All information on this forum is for educational purposes only and is not intended to provide financial advice. Any statements posted by forum members or the MT4talk EA Tester Team about profits or income expressed or implied, do not represent a guarantee. Your actual trading may result in losses as no trading system is guaranteed. You accept full responsibilities for your actions, trades, profit or loss, and agree to hold the MT4talk team and forum members of this information harmless in any and all ways.
Affiliates Disclaimer - The website may have links to partner websites, and if you sign up and trade through these links, we will receive a commission. Our affiliate partners are FXOpen, FBS, Plexytrade, and MyForexVPS.
Copyright MT4talk.com Forum Rules - Privacy Policy.