Log in or register to download unlimited Forex robots!
Moving Average Convergence Divergence (MACD): A Beginner`s Guide
Introduction to MACD
Moving Average Convergence Divergence, commonly known as MACD, is a vital tool in technical analysis used to identify changes in the strength, direction, momentum, and duration of a trend in a stock's price. It's a trend-following momentum indicator that shows the relationship between two moving averages of a security's price. The MACD is calculated by subtracting the 26-period Exponential Moving Average (EMA) from the 12-period EMA. The result of this calculation is the MACD line. A nine-day EMA of the MACD, called the "signal line," is then plotted on top of the MACD line, which can function as a trigger for buy and sell signals. Traders may buy the security when the MACD crosses above its signal line and sell - or short - the security when the MACD crosses below the signal line.
MACD Formula and Calculation
The MACD is calculated using a relatively straightforward formula:
MACD=12-Period EMA−26-Period EMA
To calculate the 12-period EMA and 26-period EMA, you need to understand the concept of the Exponential Moving Average. This type of moving average gives more weight to recent prices and reacts more quickly to price changes than a simple moving average (SMA). The EMA of the MACD line is then used to create the signal line.
Interpreting MACD
Understanding the MACD line, signal line, and histogram is crucial for interpreting its signals. The MACD line crossing above the signal line indicates a bullish signal, suggesting it might be time to buy. Conversely, a cross below the signal line indicates a bearish signal, which might be a time to sell. The MACD histogram, which plots the distance between the MACD and its signal line, is also a useful tool. If the MACD is above the signal line, the histogram is positive. If the MACD is below the signal line, the histogram is negative.
Practical Examples of MACD Analysis
Let's consider a practical example. If the MACD line crosses above the signal line, it's a bullish signal, indicating it might be time to buy. If the MACD line crosses below the signal line, it's a bearish signal, suggesting it might be time to sell. Bullish and bearish divergences between the MACD and the price action can also provide trade signals. For instance, if the stock price is making new highs but the MACD is not, it could indicate a bearish divergence and a potential reversal.
Using MACD in Trading Strategies
MACD can be a powerful tool in a trader's arsenal. It can help identify potential entry and exit points, and when used in conjunction with other indicators, it can provide a more comprehensive view of the market. However, it's important to remember that no indicator is foolproof. It's always recommended to use MACD as part of a broader trading strategy.
Limitations and Drawbacks of MACD
While MACD is a popular and useful indicator, it's not without its limitations. One major drawback is that it's a lagging indicator. This means it relies on past price action and might not accurately predict future market movements. It's also prone to providing false signals in a sideways or ranging market.
Conclusion
MACD is a versatile and widely-used technical analysis tool that can help traders identify trends and make informed trading decisions. By understanding and applying its principles, traders can enhance their ability to navigate the markets. However, it's important to use MACD in conjunction with other tools and indicators to validate its signals.
I've been trying to understand the MACD line and was wondering which indicator I could use alongside it for successful technical analysis. Could you recommend something for me? Also, what time frame does the MACD indicator work best with? Daily, weekly?
Why don't many people post their daily winning results?
MT4talk PRO members can Turn off MT4talk daily winning result post requirements for $49.99 / month. More info...
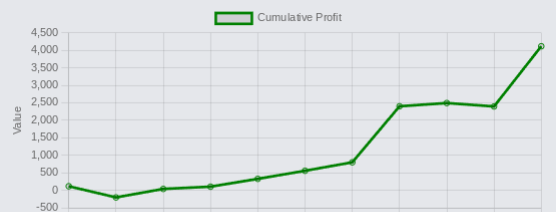
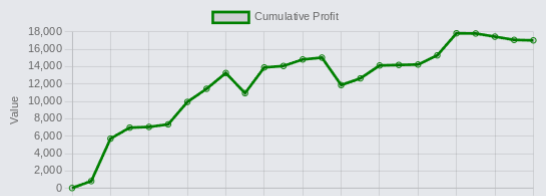
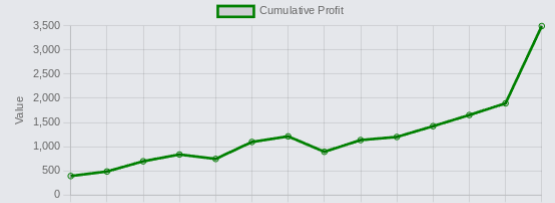
Latest profit posts from the Trade Executor EA users.
By using the MT4talk website, you automatically agree to the Forum Rules & Terms of Use, as well as the terms below.
Everything you see on the MT4talk website is created by its users, mainly the members of the MT4talk forum, as well as the forum administrators.
What is MT4talk?
MT4talk is an online Forex forum with over 5000 Forex robots and over 3000 Forex indicators uploaded by forum members in the last 10 years, available to download from forum posts. The uploaded files do not come with support or any guarantee.
The website does not sell Forex robots and does not provide support for any downloaded Forex robots. MT4talk offers a PRO membership, allowing you to download unlimited files from forum posts. If you choose to download a Forex robot from the forum, you do so at your own risk.
The MT4talk Team also provides an Artificial Intelligence Forex robot called "Trade Executor EA," which can be downloaded by PRO members, just like any other Forex robot on the forum. This Forex robot is only a bonus and is not included in the original PRO membership.
MT4talk is an informational website and does not guarantee the performance, profitability, or reliability of any Forex robot available for download. Updates for Forex robots may be limited or nonexistent, depending on the creator. If you choose to download any Forex robot or setting file from the forum, you acknowledge that you are using it at your own risk. MT4talk PRO membership is a digital product. Therefore, after you complete the PRO membership purchase, there is no refund available!
We are conducting real-life tests on Forex robots to assess their performance. For certain robots, we may use a demo account to conduct tests, and for other Forex robots, we may use a real Forex account. It's essential to recognize that we are not financial advisors and cannot provide investment guidance. Our objective is to discover effective market analysis solutions through testing various strategies, which could be beneficial to our community.
CFTC RULE 4.41 – HYPOTHETICAL OR SIMULATED PERFORMANCE RESULTS HAVE CERTAIN LIMITATIONS. UNLIKE AN ACTUAL PERFORMANCE RECORD, SIMULATED RESULTS DO NOT REPRESENT ACTUAL TRADING. ALSO, SINCE THE TRADES HAVE NOT BEEN EXECUTED, THE RESULTS MAY HAVE UNDER-OR-OVER COMPENSATED FOR THE IMPACT, IF ANY, OF CERTAIN MARKET FACTORS, SUCH AS LACK OF LIQUIDITY. SIMULATED TRADING PROGRAMS, IN GENERAL, ARE ALSO SUBJECT TO THE FACT THAT THEY ARE DESIGNED WITH THE BENEFIT OF HINDSIGHT. NO REPRESENTATION IS BEING MADE THAT ANY ACCOUNT WILL OR IS LIKELY TO ACHIEVE PROFIT OR LOSSES SIMILAR TO THOSE SHOWN.
Disclaimer - No representation is being made that any Forex account will or is likely to achieve profits or losses similar to those shown on backtests in this forum. In fact, there are frequently sharp differences between hypothetical performance results and the actual results subsequently achieved by any particular trading program. Hypothetical trading does not involve financial risk, and no hypothetical trading record can completely account for the impact of financial risk in actual trading. All information on this forum is for educational purposes only and is not intended to provide financial advice. Any statements posted by forum members or the MT4talk EA Tester Team about profits or income expressed or implied, do not represent a guarantee. Your actual trading may result in losses as no trading system is guaranteed. You accept full responsibilities for your actions, trades, profit or loss, and agree to hold the MT4talk team and forum members of this information harmless in any and all ways.
Affiliates Disclaimer - The website may have links to partner websites, and if you sign up and trade through these links, we will receive a commission. Our affiliate partners are FXOpen, FBS, Plexytrade, and MyForexVPS.
Copyright MT4talk.com Forum Rules - Privacy Policy.


